Molecular Modeling Practical
This tutorial introduces the student to the practice of Molecular Dynamics (MD) simulations of proteins. The protocol used is a suitable starting point for investigation of proteins, provided that the system does not contain non-standard groups. At the end of the tutorial, the student should know the steps involved in setting up and running a simulation, including some reflection on the choices made at different stages. Besides, the student should know how to perform quality assurance checks on the simulation results and have a feel for methods of analysis to retrieve information.
Prion proteins
 Prion Proteins are expressed on
the cell surface and are involved in copper binding, although their exact
function is still unclear. Specific misfoldings of these proteins create prions
(PRoteinaceous and Infectious, added extension -on), which can induce
misfolding themselves and thus propagate the condition. The misfolded proteins
aggregate and cause severe and fatal neurodegenerative disorders, such as
Creutzfeld-Jakob Disease (CJD) in humans, Bovine Spongiform Encephalopathy
(BSE) in cows (mad cow disease) and scrapie in sheep. Misfolding can occur due
to mutations or due to infection with prions from food sources.
Prion Proteins are expressed on
the cell surface and are involved in copper binding, although their exact
function is still unclear. Specific misfoldings of these proteins create prions
(PRoteinaceous and Infectious, added extension -on), which can induce
misfolding themselves and thus propagate the condition. The misfolded proteins
aggregate and cause severe and fatal neurodegenerative disorders, such as
Creutzfeld-Jakob Disease (CJD) in humans, Bovine Spongiform Encephalopathy
(BSE) in cows (mad cow disease) and scrapie in sheep. Misfolding can occur due
to mutations or due to infection with prions from food sources.
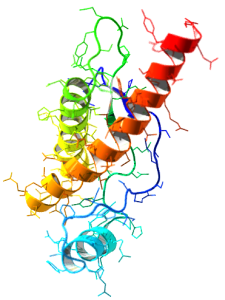
Full length human PrP is a 253 amino acid protein. The structure of PrP has been solved by NMR and by X-ray crystallography and is characterized by an N-terminal flexible region preceding a globular domain containing three alpha helices, forming an orthogonal bundle. The structure of the globular domain has been solved by NMR for many different animal species, including cow, sheep, elk, hamster, chicken, turtle and frog. Interestingly, these animals display different susceptibilities to prion disease, which may be connected to differences in the dynamics of the protein.
To investigate whether different forms of Prion Protein display different features in terms of conformation and dynamics, simulations will be performed on a number of them and the results will be compared to each other. Every student is to select one structure from the tables below.
Prion protein fragments from different species
| 1QM3 | Human (Homo sapiens) | Residues 121-230 |
| 1B10 | Syrian hamster (Mesocricetus auratus) | Residues 90-231 |
| 1DWZ | Cow (Bos taurus) | Residues 121-230 |
| 1U5L | Red-eared slider turtle (Trachemys scripta) | Residues 121-226 |
| 1XU0 | African clawed frog (Xenopus laevis) | Residues 98-226 |
| 1XYJ | Cat (Felis catus) | Residues 121-231 |
| 1XYK | Dog (Canis lupus familiaris) | Residues 121-231 |
| 1XYQ | Pig (Sus scrofa) | Residues 121-231 |
| 1XYU | Sheep (Ovis aries) | Residues 121-231, variant H168 |
| 1Y2S | Sheep (Ovis aries) | Residues 121-231, variant R168 |
| 1XYW | Elk (Cervus elaphus nelsoni) | Residues 121-231 |
| 1XYX | Mouse (Mus musculus) | Residues 121-231 |
| 2K56 | Bank vole (Myodes glareolus) | Residues 121-231 |
| 2KU4 | Horse (Equus caballus) | Residues 121-231 |
| 2KFL | Tammar Wallaby (Macropus eugenii) | Residues 121-230 |
| 2FJ3 | Rabbit (Oryctolagus cuniculus) | Residues 91-228 |
| 2JOH | Rabbit (Oryctolagus cuniculus) | Residues 91-228, TSE resistant variant S173N |
| 2JOM | Rabbit (Oryctolagus cuniculus) | Residues 91-228, TSE resistant variant I214V |
Prion protein fragments from mouse with various mutations
| 1Y15 | Mouse (Mus musculus) | Residues 121-231, N174T (cf. elk) |
| 1Y16 | Mouse (Mus musculus) | Residues 121-231, S170N and N174T (cf. elk) |
| 2KFM | Mouse (Mus musculus) | Residues 121-231, Y225A and Y226A |
| 2KFO | Mouse (Mus musculus) | Residues 121-231, V166A |
| 2K5O | Mouse (Mus musculus) | Residues 121-231, S170N (cf. bank vole) |
| 2KU5 | Mouse (Mus musculus) | Residues 121-231, D167S (cf. horse) |
| 2KU6 | Mouse (Mus musculus) | Residues 121-231, D167S and N173K (cf. horse) |
| 2L1D | Mouse (Mus musculus) | Residues 121-231, Y169G |
| 2L1E | Mouse (Mus musculus) | Residues 121-231, F175A |
| 2L1H | Mouse (Mus musculus) | Residues 121-231 at 20 C |
| 2L1K | Mouse (Mus musculus) | Residues 121-231, Y169A, Y225A and Y226A |
| 2L39 | Mouse (Mus musculus) | Residues 121-231 at 37 C |
| 2L40 | Mouse (Mus musculus) | Residues 121-231, Y169A |
Starting structures
Before anything else, starting structures have to be
obtained. These can be retrieved from
the Protein Databank,
which is a repository for three dimensional structures of
proteins. It contains approximately 100 structures of prion
proteins on a total of over 75000 structures. To start the
tutorial, download the structure you selected from the table
above, using the ID listed. In addition, download the human
prion protein, which has ID 1qlz. from the
database.
from the
database.
Check whether the downloaded structure is in fact a Prion Protein; Don't mistake 1qlz for 1q1z or 1xuo for 1xu0.
Write down the animal species and the variant of your protein in your report.
Visualization
Now first have a look at the structure in a molecular viewer. The following instructions are for Pymol, which should be available on your machine. Load the structures in Pymol using
pymol *.pdb
Now Pymol should start and a window should appear showing the structures in line representation. The models are listed on the right side of the main window and can be removed from view by clicking on the name. Next to each model name are menus which allow changing the representation. Try to show the structures as cartoons and color each chain with rainbow colors from N- to C-terminus. For those inclined to use a keyboard, which is strongly encouraged, the above can also be achieved by typing in the window:
disable 1qlz
(turn structure 1qlz off)
enable 1qlz
(turn the structue back on)
hide everything, all
show cartoon, all
spectrum count, rainbow, 1qlz
To get a better view of the structural homology, fit each structure onto the human form (1qlz). This can be done using the command 'align'. To align structure 1xyw onto 1qlz type:
align 1xyw, 1qlz
Note the similarities and dissimilarities between the different models. To see the differences better, it may be necessary to give each model a separate color again. Try zooming in on regions which are different and look at specific residues. You can change the representation of parts of a molecule by right-clicking on the chain. If you like the image you have, you can further improve it by typing 'ray' and save the resulting picture using 'png filename' to have a lasting memory of this tutorial.
Save an image of the aligned structures for the report
Now exit Pymol using the command 'quit'. As you may have noticed, all the
information necessary to draw the structures is in the respective .pdb
files. Have a look at the file using the command 'less' and try to understand
the file format. 'less' is somewhat like 'more', but allows more control. The
space bar and 'b' scroll forward and backward respectively, and with 'g' and
'G', you can go all the way to the top or to the end.
The PDB file contains a lot of information regarding the protein,
the experimental methods used, conditions, etc. It also contains a listing of
each atom with the Cartesian coordinates. Note that there is no information in
the file regarding bonding, whereas Pymol, as most molecular viewers do, did
draw bonds between atoms. These bonds were inferred from the interatomic distances.